
The Profitable Growth Ceiling (PGC)
A New Framework for Valuing and Navigating Sustainable SaaS Growth


The Growth Ceiling Reimagined: Beyond Aggregate Metrics
The Power of Max MRR
In the complex lexicon of Software-as-a-Service (SaaS) metrics, few concepts offer the immediate, visceral clarity of 'Max MRR' as introduced by Jason Cohen. Introduced as a powerful tool to dispel common misconceptions about churn and growth, Max MRR provides a tangible "growth ceiling"—a predictable and trackable number that represents the maximum potential size of a business under its current operating conditions.1 Its power lies in its elegant simplicity.
The metric is calculated using a straightforward formula that establishes the equilibrium point where new revenue gains are perfectly offset by revenue losses from churn.1
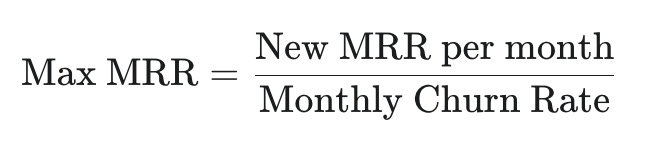
For a company adding $1,000 in new Monthly Recurring Revenue (MRR) each month with a 5% monthly customer churn rate, the growth ceiling is $20,000 MRR ($1,000 / 0.05). The business will grow quickly when its current MRR is far from this ceiling, but as it accumulates customers, the absolute dollar value of churn increases, inexorably slowing growth until it plateaus at this maximum level.1 This model brilliantly explains the common startup phenomenon of rapid initial growth that tapers off unexpectedly, not due to market saturation, but due to the non-linear, exponential drag of churn.
The Reliance on Aggregate Model
Despite its intuitive power, the standard Max MRR model has its reliance on monolithic aggregates. The formula treats 'New MRR' and 'Churn Rate' as uniform, undifferentiated inputs, masking the complex and varied realities of customer acquisition and retention. Consider the fundamental SaaS revenue equation:
Revenue = Acquisition x Conversion x ARPU - Churn.2
This is analogous to the classic "leaky bucket" model of SaaS. Max MRR calculates the point at which the water level stabilizes. The flaw is that it assumes all water poured into the bucket (New MRR) costs the same to acquire, and that all holes in the bucket (churn) are of equal size and consequence.
In any real-world business, this is never the case. Water from a high-intent, organic source is far cheaper and more likely to stay in the bucket than water sprayed indiscriminately from a high-cost firehose. The aggregate model cannot distinguish between the two.
The Channel as the Cohort: Introducing Channel-Specific Vital Signs

Why the Acquisition Channel is the Ultimate Strategic Cohort
Cohort analysis is a cornerstone of SaaS analytics, allowing businesses to group users by shared characteristics to understand behavior over time. Common approaches include segmenting by acquisition date (e.g., the "January 2023 cohort") or by user behavior (e.g., users who completed onboarding vs. those who did not).6 While these methods provide valuable insights, the most strategically actionable cohort for guiding investment and resource allocation is the acquisition channel.
The acquisition channel cohort is unique because it directly links an outcome (customer acquisition and subsequent behavior) to a controllable input (marketing and sales spend). Analyzing performance by channel such as paid search, organic content, direct sales, or partnerships allows leadership to answer fundamental business questions with precision: "Do we get a better ROI from direct sales or from channel sales?".3
This level of granularity is essential for allocating budgets effectively, focusing on high-performing channels, and optimizing the entire marketing mix to maximize return on investment.4 It bridges the gap between marketing activity and financial outcomes, creating a clear line of sight from spend to long-term value.
Foundational Metric 1: Channel-Specific Max MRR (CS-Max MRR)
To begin building our strategic compass, we must first calculate the growth ceiling for each individual acquisition channel. This metric, which we will term Channel-Specific Max MRR (CS-Max MRR), reveals the inherent growth potential of each distinct marketing and sales effort.
The formula is a direct adaptation of the original Max MRR concept, applied at a granular level:
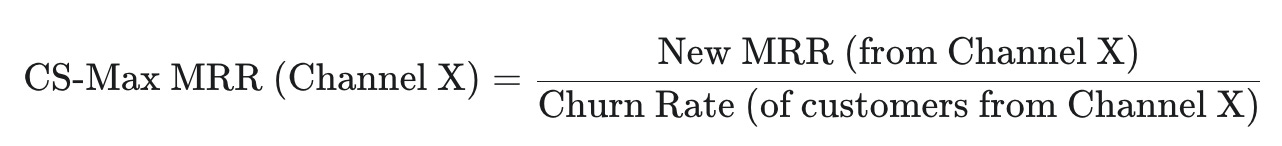
Calculating CS-Max MRR requires a robust marketing attribution model capable of assigning both the initial New MRR and the subsequent churn behavior of a customer to the correct originating channel.4 The resulting metric can be revelatory. For example, a content marketing channel may generate a modest amount of
Foundational Metric 2: Channel-Specific LTV:CAC Ratio
A high CS-Max MRR indicates that a channel has a high growth ceiling, but it does not guarantee that reaching that ceiling is a worthwhile endeavor. A channel could produce sticky customers but at an acquisition cost so high that the business loses money on every new sign-up. Therefore, CS-Max MRR must be analyzed in conjunction with a second foundational metric: the channel-specific LTV:CAC ratio. This ratio measures the profitability of each acquisition channel.
Calculating this ratio requires a channel-specific approach to both Customer Lifetime Value (LTV) and Customer Acquisition Cost (CAC).
Channel-Specific LTV: The LTV formula, often expressed as LTV = (ARPA × Gross Margin) / Churn Rate, must be calculated using the specific churn rate of the customer cohort acquired from that channel.11 A lower churn rate for a given channel will result in a significantly higher LTV for customers from that source.
Channel-Specific CAC: The CAC for a specific channel is calculated by dividing the total sales and marketing expenditure on that channel by the number of new customers acquired through it: CAC (Channel X) = Total S&M Spend (on Channel X) / New Customers (from Channel X).5 Accurately attributing these costs can be challenging and is a critical dependency for this analysis.3
The resulting LTV:CAC ratio for each channel provides the crucial profitability context. The widely accepted industry benchmark for a healthy and sustainable SaaS business is an LTV:CAC ratio of 3:1 or higher.11 This means that for every dollar spent acquiring a customer, the business generates at least three dollars in lifetime value. This threshold will serve as our primary filter for determining whether a channel's growth is sustainable.
Simulation: A Tale of Three Channels and Two Ceilings
Introducing 'Sustainalytics Inc.': A Hypothetical SaaS Company
To illustrate the power of this channel-level framework, we will conduct a simulation using a hypothetical B2B SaaS company, "Sustainalytics Inc." Sustainalytics offers a project management and sustainability reporting tool with an Average Revenue Per Account (ARPA) of $100 per month.
On the surface, Sustainalytics appears to be a healthy, growing business. An analysis of its aggregate metrics presents a positive picture:
Current MRR: $1,000,000
Total New MRR / month: $65,000
Blended Monthly Churn Rate: 3.6% (calculated as a weighted average of channel churn rates based on new customer volume)
Aggregate Max MRR: $65,000 / 0.036 = $1,805,556
This conventional, top-level view suggests that Sustainalytics has a clear growth runway of over $800,000 in MRR before its growth engine naturally stalls. A leadership team relying solely on these aggregate figures would likely conclude that their current strategy is effective and requires no significant adjustments.
Deconstructing the Growth Engine: A Channel-Level View
The strategic illusion begins to dissolve when we deconstruct Sustainalytics' growth engine into its three primary acquisition channels. Each channel exhibits vastly different performance characteristics, reflecting common real-world SaaS marketing tactics.16
Channel A: Paid Performance Marketing (PPC & Social Ads): This channel is designed for high-volume lead generation. It drives the majority of new MRR but at a significant cost and attracts a broad audience, many of whom are not an ideal fit for the product.
New MRR / month: $40,000
Monthly CAC Spend: $250,000
Channel-Specific Churn Rate: 8.0%
Channel B: Content & SEO (Organic Search): This channel focuses on attracting high-intent prospects through valuable content and strong search engine rankings. It generates fewer new customers than paid marketing but at a much lower cost, and these customers tend to be a better long-term fit.
New MRR / month: $20,000
Monthly CAC Spend: $20,000
Channel-Specific Churn Rate: 2.5%
Channel C: Referral Program: This channel leverages the existing customer base to acquire new users. It produces the lowest volume of new MRR but at a negligible cost, and the referred customers are typically an excellent fit, exhibiting the highest loyalty.
New MRR / month: $5,000
Monthly CAC Spend: $1,000 (for rewards and platform management)
Channel-Specific Churn Rate: 1.0%
Analysis Part 1: The Illusion of the Aggregate vs. The Granular Reality
With the channel-level data established, we can now perform a comprehensive diagnostic analysis, calculating the key vital signs for each growth engine. The following table contrasts the performance of each channel and reveals the true nature of Sustainalytics' business model.
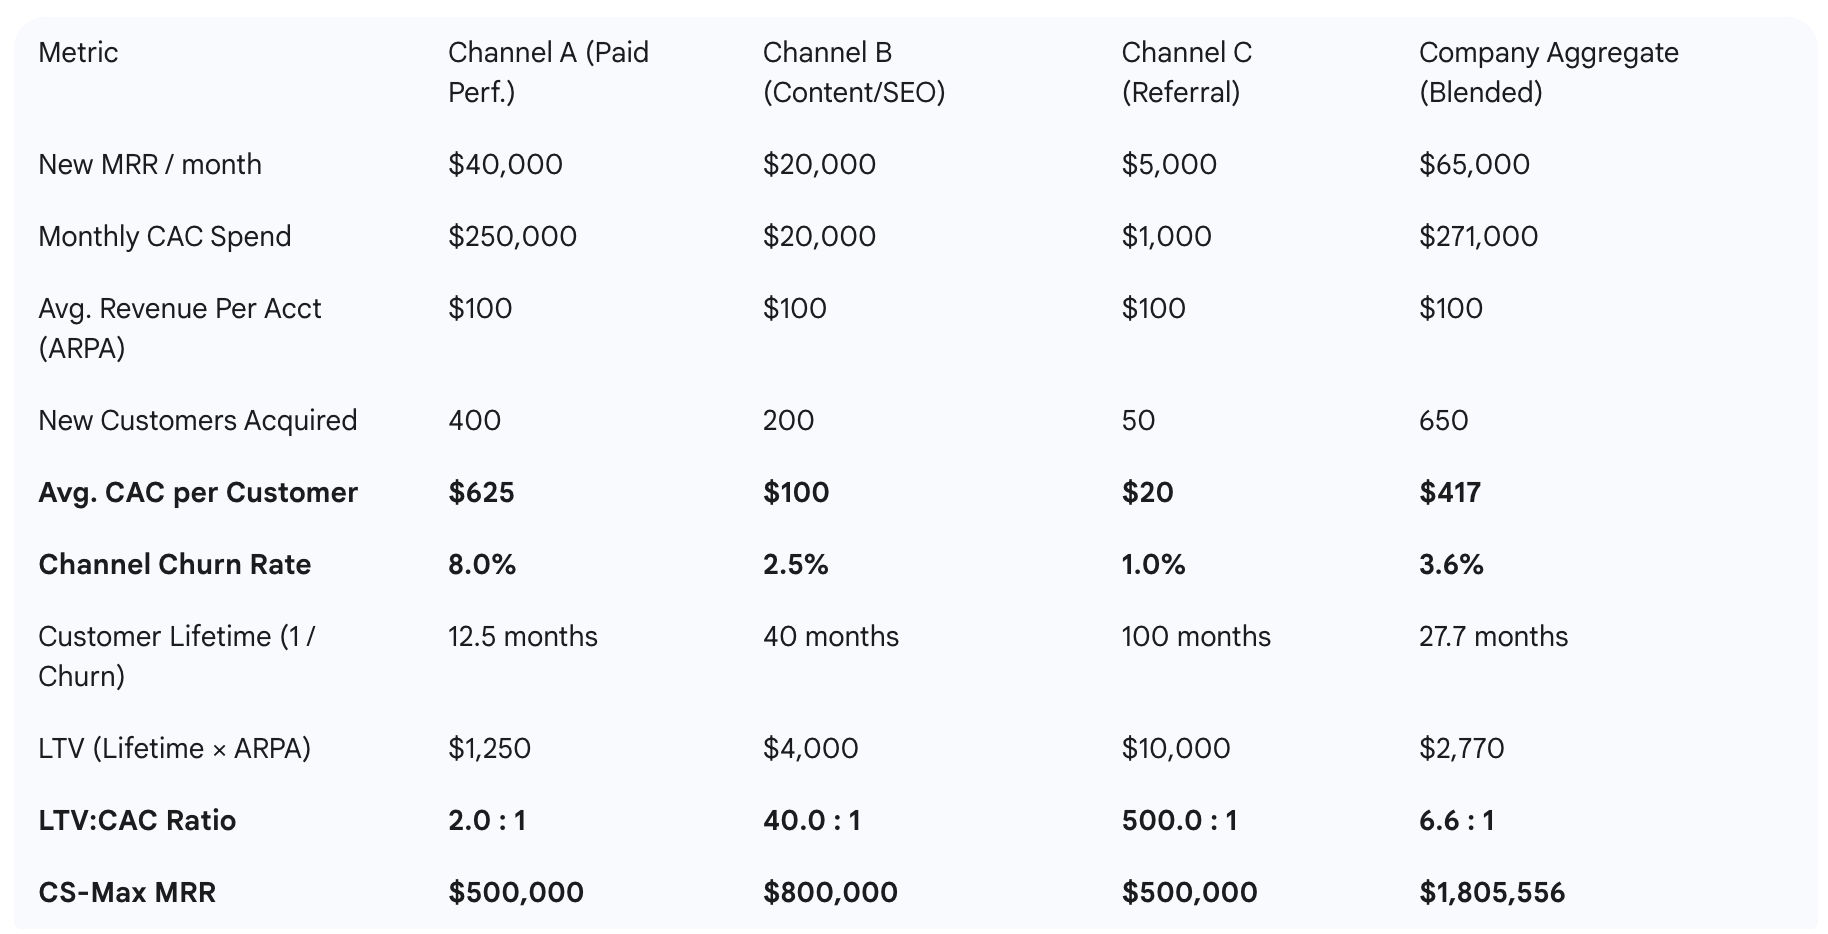
We can now see that Sustainalytics' growth strategy is not a monolith but a portfolio of activities with dramatically different risk and reward profiles.
Channel A (Paid Performance), the largest contributor to New MRR, is fundamentally unprofitable. Its LTV:CAC ratio of 2.0:1 is well below the 3:1 sustainability threshold. For every dollar invested, the company only gets two dollars back over the customer's lifetime, which is insufficient to cover all other business costs and generate a profit. This channel is actively destroying long-term value.
Channel B (Content & SEO) is the true workhorse of the business. It is exceptionally profitable, with a 40:1 LTV:CAC ratio, and its low churn rate gives it the highest growth ceiling of any channel ($800,000).
Channel C (Referral) is hyper-profitable but currently contributes the least in terms of volume.
This simulation reveals that a company's growth strategy is effectively a portfolio management problem. Some channels, like paid advertising, can be viewed as high-risk, high-volume tactics that provide rapid but potentially unprofitable growth.
Others, like content and SEO, are akin to long-term, stable assets that require patient investment but yield highly profitable, sustainable returns. A healthy SaaS business requires a balanced portfolio, and a framework that allows leadership to manage this mix is essential.
A CEO looking only at aggregate New MRR would be incentivized to pour more capital into Channel A, chasing volume while accelerating the company toward an unprofitable plateau. This channel-level analysis provides the necessary insight to avoid that catastrophic error and instead reallocate resources toward building a truly resilient business.
The Profitable Growth Ceiling (PGC): A New North Star Metric
Formal Definition of the Profitable Growth Ceiling (PGC)
The channel-level analysis reveals the strengths and weaknesses of a company's growth portfolio. To synthesize this granular data into a single, actionable North Star metric, we introduce the Profitable Growth Ceiling (PGC).
Definition: The Profitable Growth Ceiling (PGC) is the sum of the Channel-Specific Max MRR (CS-Max MRR) for only those acquisition channels that meet a minimum predefined profitability threshold.
This metric represents the maximum MRR a company can achieve if it relies exclusively on its sustainable, value-creating growth engines. It is the true ceiling for profitable growth.
For the purpose of this framework, we will establish the standard profitability threshold as an LTV:CAC ratio greater than or equal to 3:1. This benchmark is widely recognized as the minimum for a healthy, scalable SaaS acquisition model, ensuring that revenue generated is sufficient to cover acquisition costs, operational expenses, and produce a profit.11
4.2 Calculating the PGC for Sustainalytics Inc.
Applying this definition to the data from our simulation for Sustainalytics Inc., the calculation of PGC is a two-step process.
Step 1: Identify Profitable Acquisition Channels.
We filter the company's channels based on the LTV:CAC ≥ 3:1 threshold.
Channel A (Paid Performance): LTV:CAC = 2.0:1. This channel fails to meet the profitability threshold and is therefore excluded from the PGC calculation.
Channel B (Content & SEO): LTV:CAC = 40.0:1. This channel is highly profitable and is included.
Channel C (Referral Program): LTV:CAC = 500.0:1. This channel is hyper-profitable and is included.
Step 2: Sum the CS-Max MRR of the Profitable Channels.
The PGC is the sum of the growth ceilings of the channels identified in Step 1.
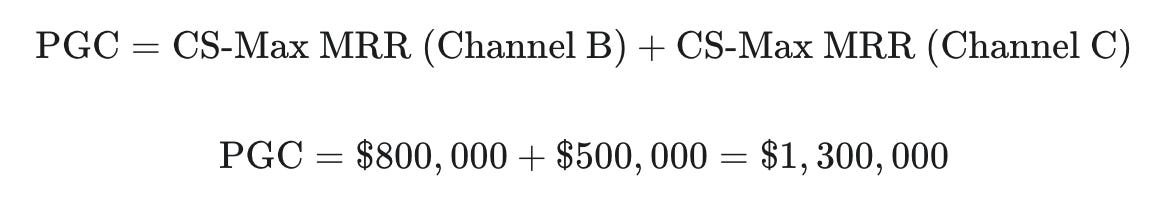
PGC=$800,000+$500,000=$1,300,000
The Profitable Growth Ceiling for Sustainalytics Inc. is $1,300,000 MRR.
4.3 The Strategic Chasm: Aggregate Max MRR vs. PGC
The PGC calculation reveals a stark and strategically vital gap between the company's perceived growth potential and its actual, sustainable potential. This chasm is best illustrated by a direct comparison.
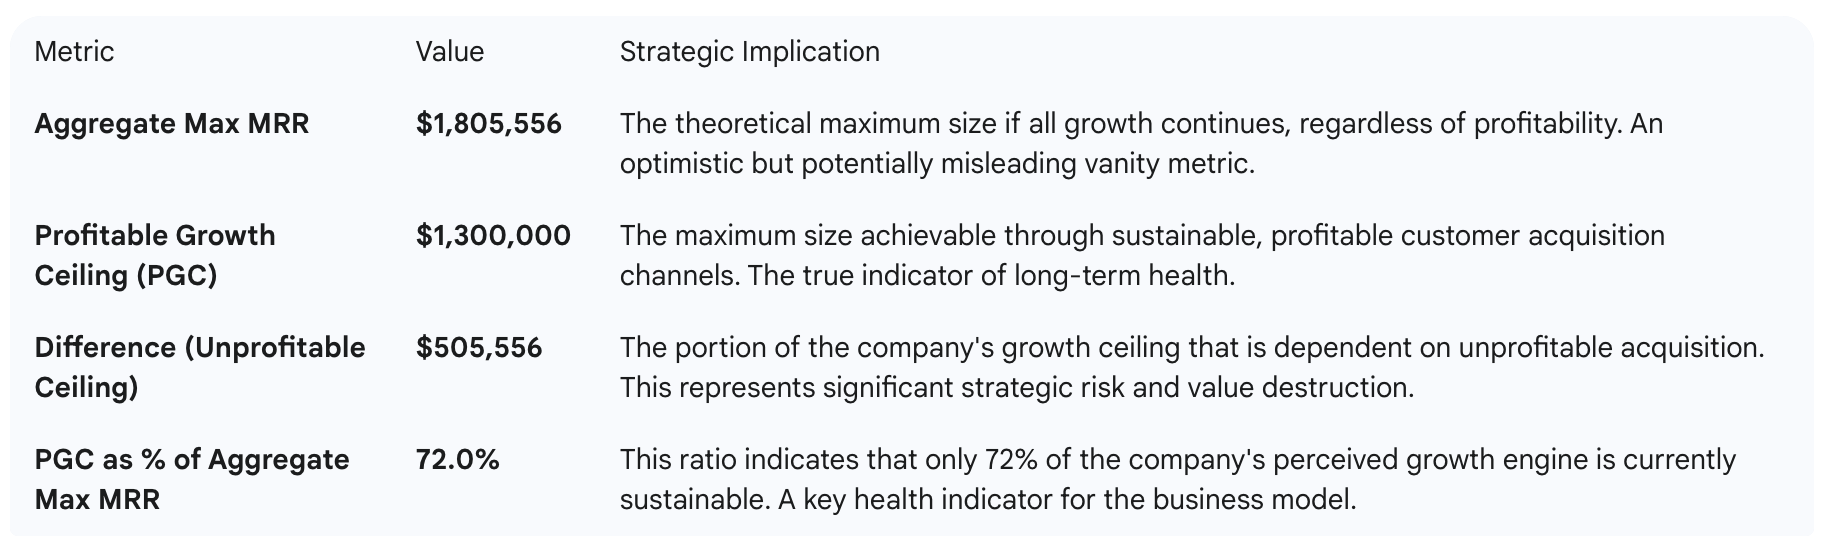
This comparison distills the entire analysis into a single, powerful narrative for an executive or board-level discussion. The "Unprofitable Ceiling" of over $500,000 is not a future asset; it is a current liability a measure of the scale of the company's dependence on a value-destroying activity.
The 72% ratio is a clear, quantifiable measure of the business model's health. The strategic imperative becomes closing this gap by improving the profitability of underperforming channels or by scaling the proven, profitable ones.
PGC as the Ultimate Leading Indicator
The PGC is more than just a corrective metric; it is the ultimate leading indicator of long-term, profitable growth, surpassing other common SaaS metrics in its strategic foresight.
Composite channel based metric: While Max MRR predicts a growth ceiling, the PGC predicts the sustainable ceiling. It answers not just "Can we grow?" but "Should we grow this way?".
Superior to Net Revenue Retention (NRR): An NRR greater than 100% is a powerful growth lever, as it signifies that revenue from existing customers is growing through expansion and upsells.1 However, a high NRR can be undermined if the initial customers were acquired at a massive financial loss. A company can have a 120% NRR but still be unprofitable if its CAC payback period is longer than its customer lifetime. The PGC framework ensures the initial acquisition is economically sound, providing a solid foundation upon which high NRR can build true value.
Superior to the SaaS Quick Ratio: The Quick Ratio ((New MRR + Expansion MRR) / (Churned MRR + Contraction MRR)) measures the efficiency of growth from a revenue perspective. However, it is fundamentally flawed as a predictor of future growth because it does not account for the cost of acquiring that New MRR.

Works cited
Max MRR - https://longform.asmartbear.com/max-mrr/
SaaS Customer Acquisition: Proven Strategies for Growth - HubiFi, accessed July 30, 2025, https://www.hubifi.com/blog/acquisition-saas-strategies
SaaS Metrics Framework - Updata Partners, accessed July 30, 2025, https://updata.com/insight/saas-metrics-framework/
Which Analytics Matter in SaaS Marketing and Why They Do - Digital Authority Partners, accessed July 30, 2025, https://www.digitalauthority.me/resources/analytics-matter-saas-marketing/
CAC by Channel: Maximizing Marketing Efficiency, accessed July 30, 2025, https://www.bentega.io/blog/cac-by-channel-maximizing-marketing-efficiency-in-saas-businesses
Churn Rate Cohort Analysis: Guide To Boost Retention - Chargebee, accessed July 30, 2025, https://www.chargebee.com/blog/chargebee-churn-rate-cohort-analysis-retention-strategies/
Cohort Analysis Interpretation and Usage for SaaS Retention - Insivia, accessed July 30, 2025, https://www.insivia.com/cohort-analysis-interpretation-and-usage-for-saas-retention/
Cohort Retention Analysis 101: How to Measure User Retention?, accessed July 30, 2025, https://userpilot.com/blog/cohort-retention-analysis/
Mastering Customer Retention Analysis For SaaS Success - Chargebee, accessed July 30, 2025, https://www.chargebee.com/blog/how-to-do-customer-retention-analysis/
SaaS Marketing Attribution in a Cookieless World - Winsome Marketing, accessed July 30, 2025, https://winsomemarketing.com/saas-marketing/saas-marketing-attribution-in-a-cookieless-world
LTV/CAC Ratio | SaaS Formula + Calculator - Wall Street Prep, accessed July 30, 2025, https://www.wallstreetprep.com/knowledge/ltv-cac-ratio/
What is SaaS LTV/CAC Ratio? Calculation & Importance - PayPro Global, accessed July 30, 2025, https://payproglobal.com/answers/what-is-saas-ltv-cac-ratio/
LTV:CAC Ratio: What It Is & How To Calculate It | Klipfolio, accessed July 30, 2025, https://www.klipfolio.com/resources/kpi-examples/saas/customer-lifetime-value-to-customer-acquisition-cost
How to Calculate & Interpret SaaS LTV - Amplitude, accessed July 30, 2025, https://amplitude.com/blog/saas-ltv
Top SaaS Analytics Tools by Category [2025] - Attribution App, accessed July 30, 2025, https://www.attributionapp.com/blog/saas-analytics-tools/
Ultimate Guide to Customer Acquisition Strategies for B2B SaaS | ProductLed, accessed July 30, 2025, https://productled.com/blog/customer-acquisition-strategies
10 Best SaaS Customer Acquisition Strategies for 2025 | Userflow Blog, accessed July 30, 2025, https://www.userflow.com/blog/best-saas-customer-acquisition-strategies
10 Best SaaS Marketing Channels: 2025 Complete Guide - Growth Kitchen, accessed July 30, 2025, https://growthkitchen.agency/post/saas-marketing-channels/
19 Customer Acquisition Channels: Which Ones Drive the Best ROI?. - Blog, accessed July 30, 2025, https://blog.propellocloud.com/customer-acquisition-channels
Customer Acquisition Strategy for SaaS Companies: A Complete Guide - Maxio, accessed July 30, 2025, https://www.maxio.com/blog/customer-acquisition-strategy-for-saas
An Expert Guide to Calculating Churn Rate in SaaS - Mosaic, accessed July 30, 2025, https://www.mosaic.tech/financial-metrics/churn-rate
Customer Cohort Analysis: A Guide for SaaS Companies - Mosaic, accessed July 30, 2025, https://www.mosaic.tech/financial-metrics/customer-cohorts
SaaS growth rates and how to calculate them in 2025 - Orb, accessed July 30, 2025, https://www.withorb.com/blog/saas-growth-rates
2025 SaaS Performance Metrics - Benchmarkit, accessed July 30, 2025, https://www.benchmarkit.ai/2025benchmarks
Navigating the AI-Infused SaaS Landscape: Freshworks' Strategic Positioning and Profitability Potential in 2025 - AInvest, accessed July 30, 2025, https://www.ainvest.com/news/navigating-ai-infused-saas-landscape-freshworks-strategic-positioning-profitability-potential-2025-2507/
Key growth levers for SaaS companies in 2025 - Simon-Kucher, accessed July 30, 2025, https://www.simon-kucher.com/en/insights/key-growth-levers-saas-companies-2025